MArket Update
October 2024
Average PRice per Sqft
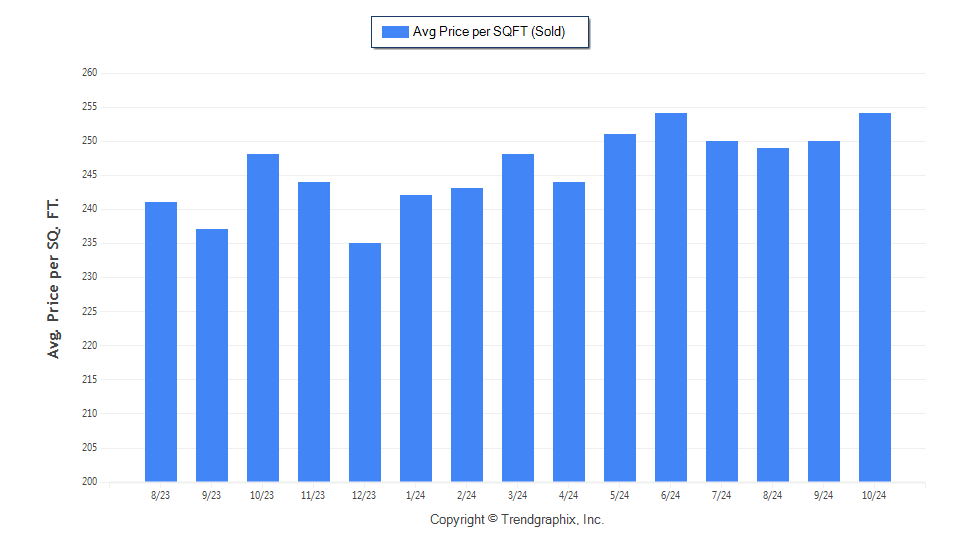
October 2024 Average Sold Price per Square Footage was Neutral*
Average Sold Price per Square Footage in October 2024: $254
| • | Up 1.6% compared to last month |
| • | Up 2.4% compared to last year |
What it means:
Increase from Last Month:
- Up 1.6%: This monthly increase suggests a slight upward trend in how much buyers are willing to pay per square foot. It could indicate stronger demand or a shift towards higher-quality or more desirable properties being sold.
Increase from Last Year:
- Up 2.4%: The year-over-year rise suggests that property values have appreciated, which is a positive sign for the market overall. It indicates that the market is still growing, albeit at a moderate pace.
Implications:
- For Sellers: This trend is encouraging as it suggests that properties are maintaining or increasing in value. It might be a good time to highlight the quality and features of homes to leverage this upward trend in pricing.
- For Buyers: While prices per square foot are increasing, the growth is moderate. Buyers might still find value in the market, especially if they focus on properties that offer good quality and location benefits.
Overall, the neutral stance on the average sold price per square footage with these increases suggests a stable and slightly appreciating market.
Days on MArket
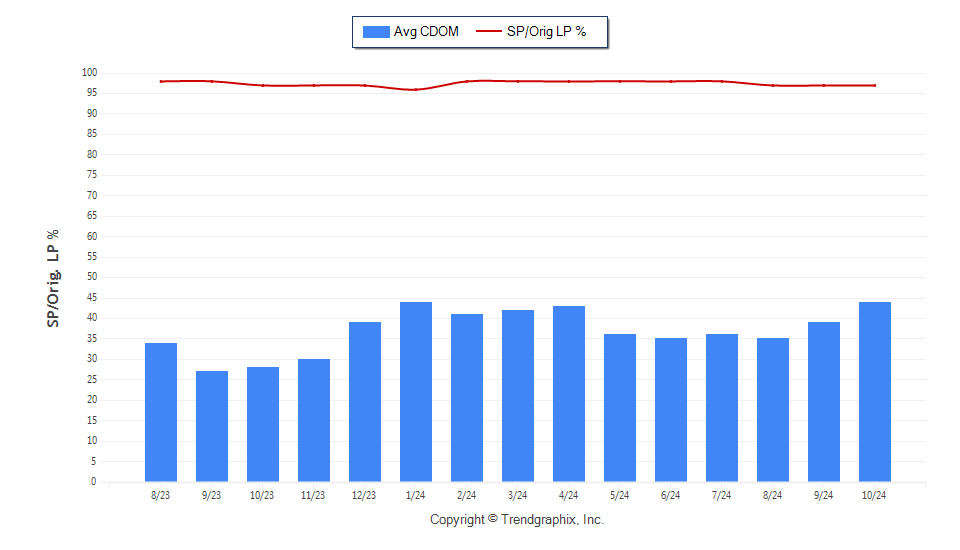
October 2024 Average Continuous Days on Market trend was Rising*
Continuous Days on Market in October 2024: 44
| • | Up 12.8% compared to last month |
| • | Up 57.1% compared to last year |
October 2024 Sold/Original List Price Ratio was Falling*
Sold/Original List Price % in October 2024: 97%
| • | 0% compared to last month |
| • | 0% compared to last year |
What it means:
Continuous Days on Market (CDOM):
- Up 11.4% from Last Month: This increase suggests that homes are taking longer to sell compared to the previous month. It might indicate a slight cooling in the market or that buyers are taking more time to make decisions.
- Up 44.4% from Last Year: A significant increase from the previous year suggests a notable shift in market conditions, possibly due to changes in buyer demand, inventory levels, or economic factors.
Sold/Original List Price Ratio:
- Steady Compared to Last Month: The ratio remaining at 97% indicates that, on average, homes are selling for slightly less than their original list price, but this hasn’t changed from the previous month.
- Down 1% from Last Year: A small decrease suggests that buyers may have a bit more negotiating power than they did a year ago, or sellers might be adjusting their expectations to align with market realities.
Implications for Homeowners and Buyers:
- For Homeowners/Sellers: The increase in continuous days on market and the slight decrease in the sold/list price ratio may mean that pricing strategies need to be more competitive, and patience may be required as homes might take longer to sell.
- For Buyers: With homes staying on the market longer and selling for slightly less than the list price, there could be opportunities for negotiating better deals.
Overall, these trends suggest a market that is stabilizing or cooling slightly, which can impact strategies for both selling and buying.
For Sale Vs. Sold
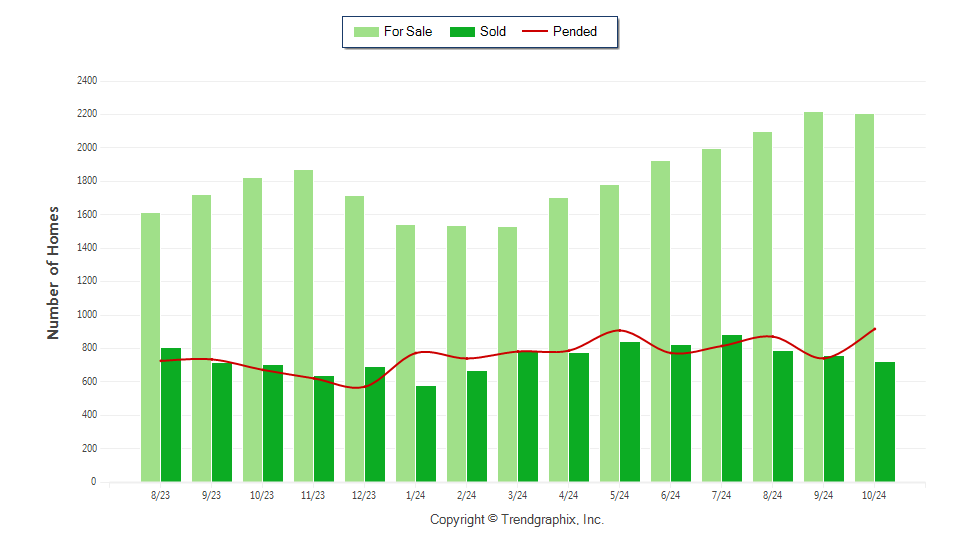
October 2024 was a Neutral market*
Home For Sale in October 2024: 2204 units.
| • | Down 0.6% compared to last month |
| • | Up 20.7% compared to last year |
Home Closed in October 2024: 722 units.
| • | Down 5.1% compared to last month |
| • | Up 2.7% compared to last year |
Home Placed under Contract in October 2024: 918 units.
| • | Up 23.7% compared to last month |
| • | Up 36.4% compared to last year |
What it means:
Homes for Sale:
- Down 0.6% from Last Month: A slight decrease in inventory month-over-month suggests a small tightening in available homes, which might be due to seasonal trends or increased buyer interest.
- Up 20.7% from Last Year: The significant year-over-year increase indicates more sellers entering the market, possibly due to favorable conditions or previous low inventory levels.
Homes Closed:
- Down 5.1% from Last Month: The decrease in closed sales could reflect seasonal slowdowns or buyers taking more time to make decisions.
- Up 2.7% from Last Year: A modest annual increase shows a steady market with slightly more activity than the previous year.
Homes Placed Under Contract:
- Up 23.7% from Last Month: A substantial increase in homes under contract month-over-month indicates a surge in buyer activity, possibly driven by attractive pricing or market conditions.
- Up 36.4% from Last Year: The strong year-over-year growth highlights increased buyer interest and confidence in the market.
Implications:
- Neutral Market: A neutral market suggests a balance between supply and demand, where neither buyers nor sellers have a distinct advantage. This can lead to fair negotiations and stable pricing.
- For Sellers: The increase in homes under contract is encouraging, but with rising inventory, competitive pricing and effective marketing are crucial to attract buyers.
- For Buyers: The neutral market conditions and increased inventory provide good opportunities to explore options and negotiate terms.
Months of Inventory
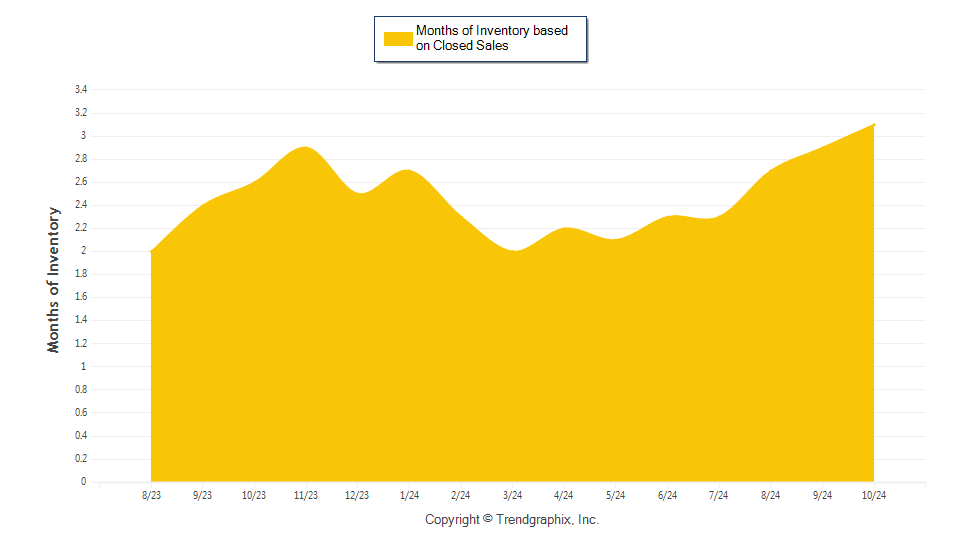
October 2024 was a Neutral market*
Months of Inventory based on Closed Sales in October 2024: 3.1
| • | Up 6.9% compared to last month |
| • | Up 19.2% compared to last year |
What it means:
- Months of Inventory at 3.1:
- Up 6.9% from Last Month: This increase indicates that the inventory of homes available for sale is growing relative to the pace of sales, suggesting a slight easing in market tightness.
- Up 19.2% from Last Year: The significant year-over-year increase points to a trend where more homes are available for sale compared to the previous year, contributing to a more balanced market.
Implications:
- Neutral Market: With 3.1 months of inventory, the market is considered neutral, meaning there is a balance between supply and demand. Neither buyers nor sellers have a clear advantage, which can lead to fairer negotiations and stable pricing.
- For Sellers: While the market is balanced, the increase in inventory suggests a need for competitive pricing and effective marketing strategies to attract buyers.
- For Buyers: The growing inventory provides more options, allowing buyers to take their time in finding the right property and potentially negotiate better terms.
Avg Price for sale & Sold
October 2024 Average For Sale Price was Neutral*
Average For Sale Price (in thousand) in October 2024: $563:
| • | Up 0.4% compared to last month |
| • | Up 1.1% compared to last year |
October 2024 Average Sold Price was Depreciating*
Average Sold Price (in thousand) in October 2024: $447
| • | Down 0.2% compared to last month |
| • | Up 2.1% compared to last year |
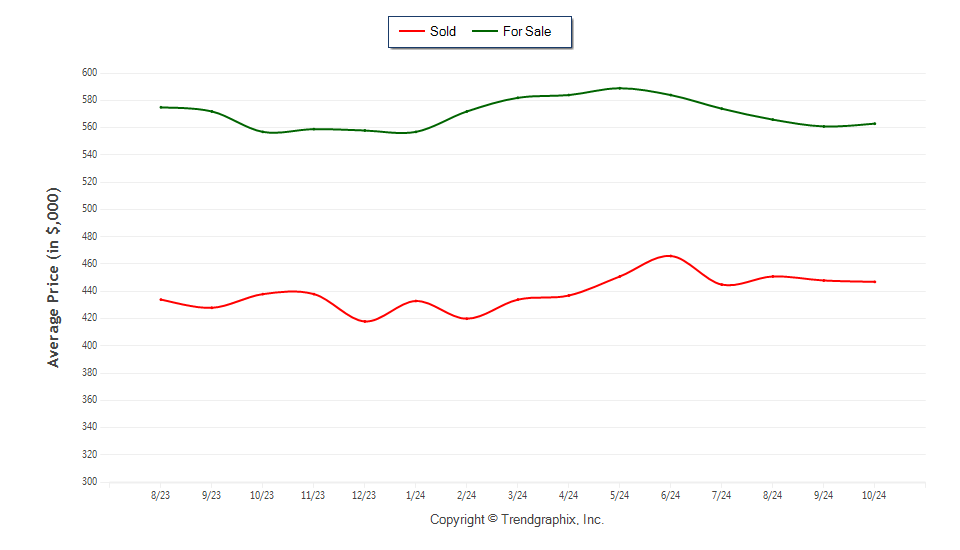
What it means:
Average For Sale Price:
- Up 0.4% from Last Month: A slight increase in the average for sale price month-over-month indicates that sellers might be testing higher price points, possibly due to perceived demand or improved property conditions.
- Up 1.1% from Last Year: The modest annual increase suggests a steady appreciation in home values, which is positive for sellers looking to capitalize on their investments.
Average Sold Price:
- Down 0.2% from Last Month: This minor decrease in the average sold price month-over-month suggests some downward pressure on closing prices, reflecting buyer negotiations or market adjustments.
- Up 2.1% from Last Year: Despite the monthly dip, the annual increase shows that overall, the market has appreciated, benefiting homeowners and sellers in the long run.
Implications:
- For Sellers: The rise in for sale prices suggests optimism among sellers, but the slight decline in sold prices indicates the importance of realistic pricing and negotiations to close deals effectively.
- For Buyers: The depreciating trend in sold prices month-over-month could provide opportunities to negotiate better deals, especially in a neutral market with more inventory.